> ## Documentation Index
> Fetch the complete documentation index at: https://docs.chift.eu/llms.txt
> Use this file to discover all available pages before exploring further.
# API Explorer
The API Explorer is a powerful tool built into the platform that allows you to test and validate Chift's API endpoints directly from your browser. You can also use it to replay existing transactions, making it an essential tool for debugging and development.
## Accessing the API Explorer
The API Explorer can be accessed in two ways:
### 1. From the sidebar
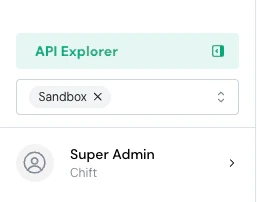
Click the **API Explorer** button at the bottom of the sidebar. This opens the API Explorer without any pre-filled context — you will need to select an operation, consumer, and connection manually.
 ### 2. From a consumer's page
Navigate to a consumer and click the **API Explorer** button in the top right corner of the page. When opened this way, the **consumer** and **connection** are automatically pre-filled based on the current consumer, so you can start testing right away.
### 2. From a consumer's page
Navigate to a consumer and click the **API Explorer** button in the top right corner of the page. When opened this way, the **consumer** and **connection** are automatically pre-filled based on the current consumer, so you can start testing right away.
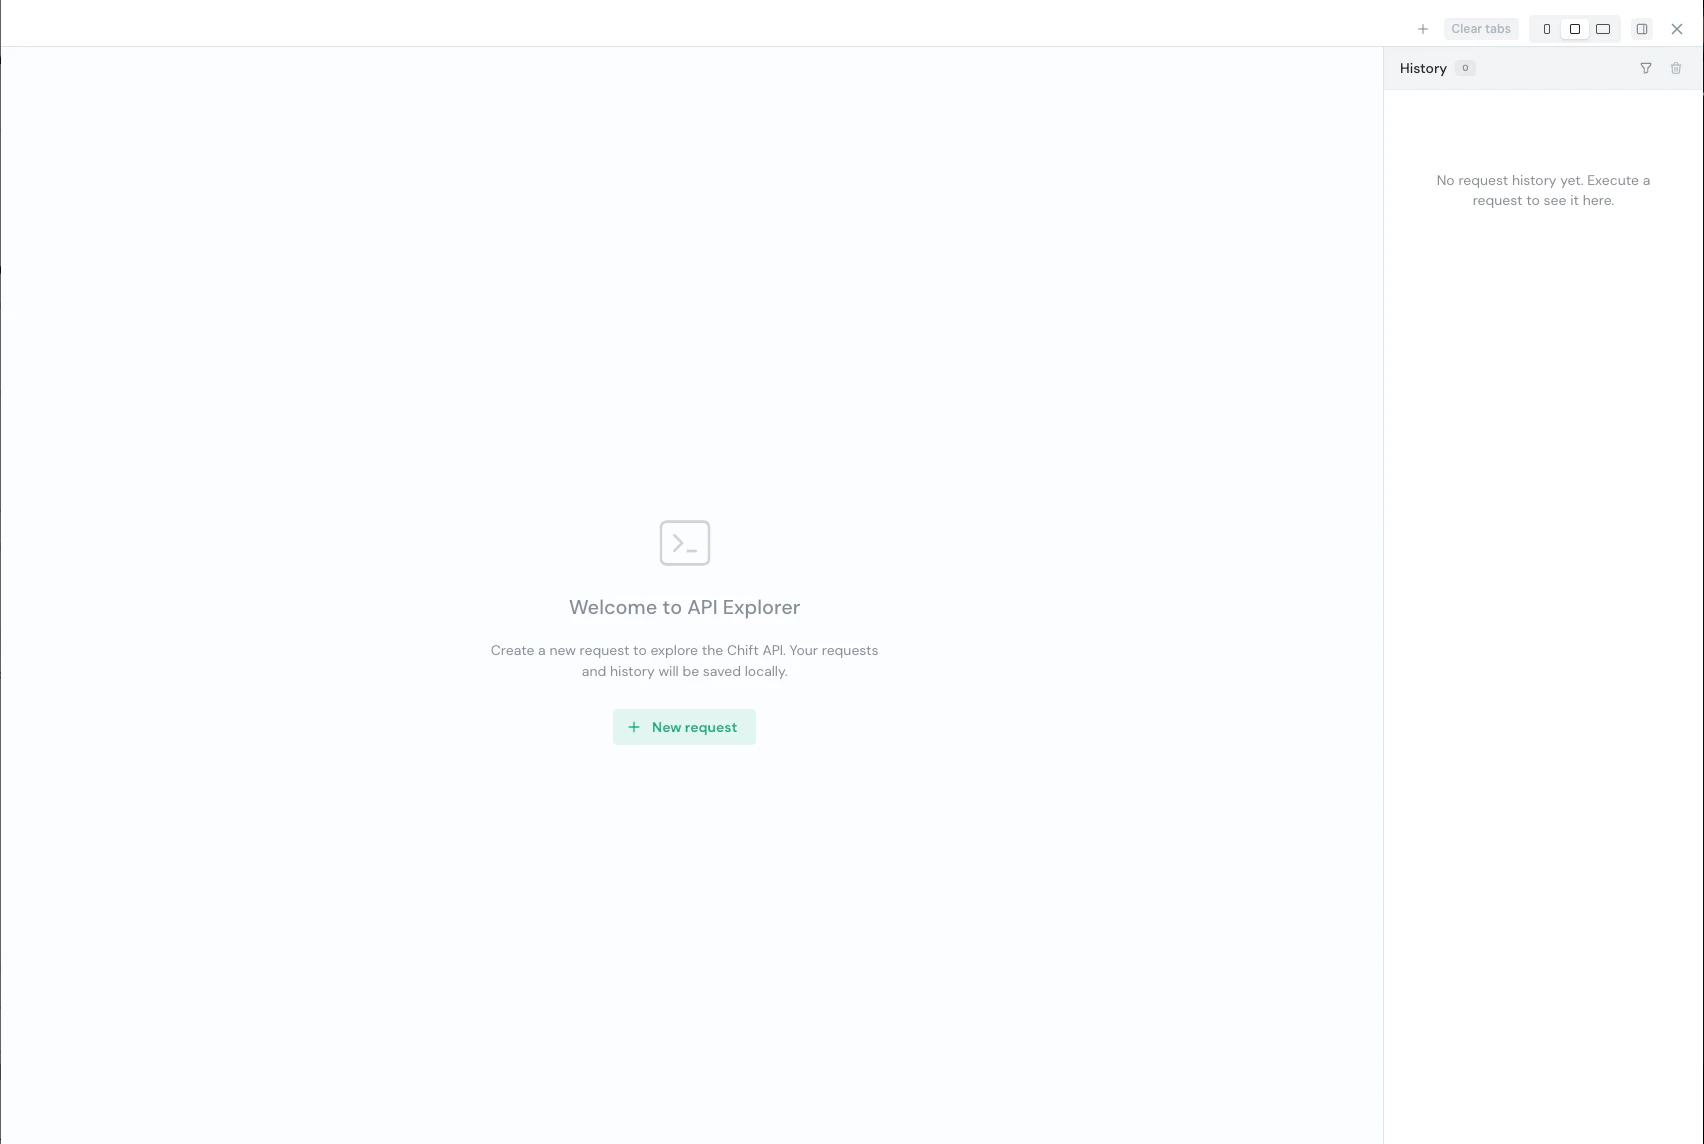
 In both cases, the API Explorer opens as a drawer panel on the right side of the screen.
 ## Selecting and executing a request
1. Click **+ New request** to create a new request tab
2. Use the **operation selector** to select the endpoint you want to test — operations are grouped by tags and displayed with their HTTP method and summary. You can search by operation name, path, or tag.
## Selecting and executing a request
1. Click **+ New request** to create a new request tab
2. Use the **operation selector** to select the endpoint you want to test — operations are grouped by tags and displayed with their HTTP method and summary. You can search by operation name, path, or tag.
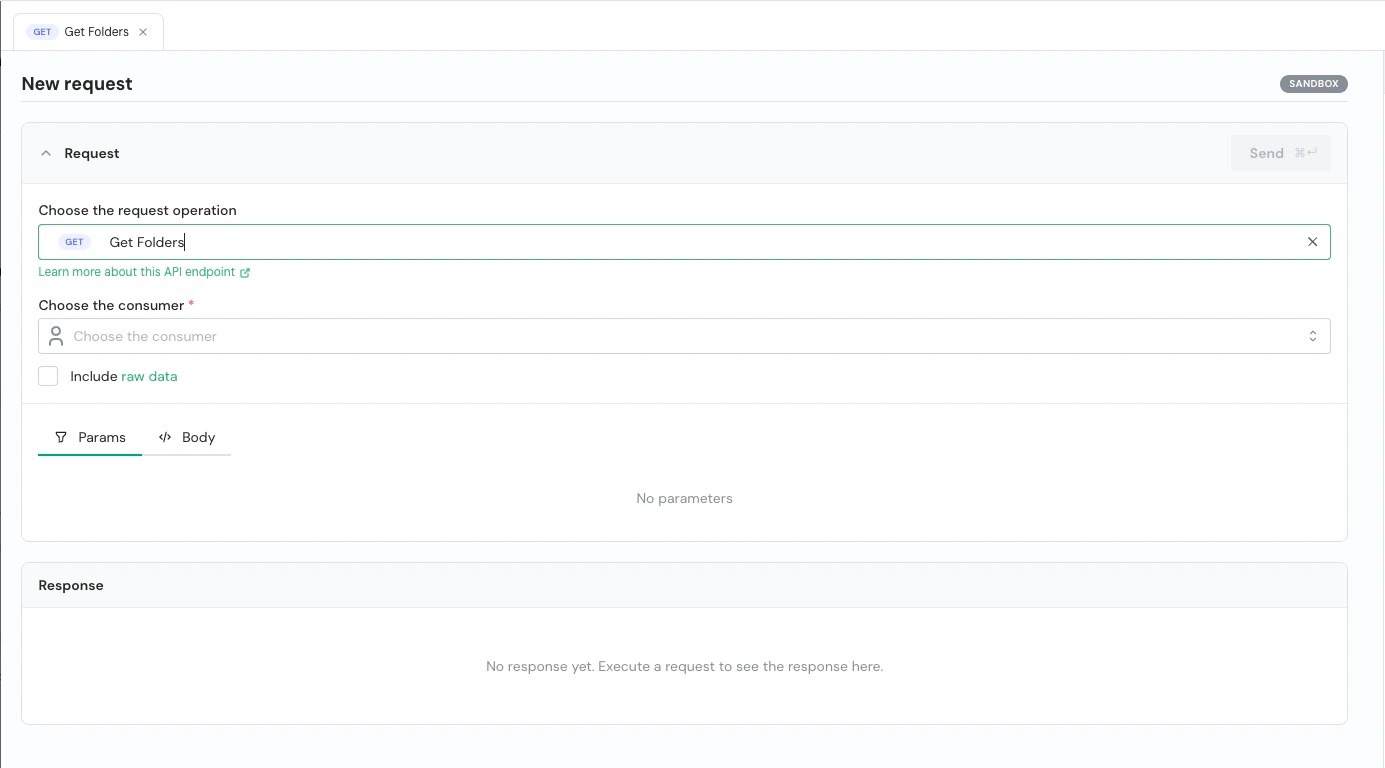 Once an operation is selected, a **"Learn more about this API endpoint"** link is displayed below, opening the corresponding API documentation in a new tab.
3. Select the **consumer** and **connection** to use. The available operations and consumers are filtered dynamically:
* When a **consumer** is selected, only operations matching the consumer's connected APIs are shown
* When an **operation** is selected, only consumers that support this API are listed
* The **connection dropdown** adapts based on available connections:
* If only one connection matches the endpoint, it is **auto-selected** and the dropdown is grayed out
* If multiple connections of the same type are available, the dropdown is **active** and lets you switch between connectors
4. You can optionally enable the **Include raw data** option. When enabled, the raw response from the target connector will be included, allowing you to compare it directly with the processed data. This option is only available for GET endpoints.
5. Fill in the required **parameters** in the **Params** tab, and provide the **request's body** in the **Body** tab when applicable (a sample body is auto-populated from the API schema when available)
6. Click **Send** to execute the request (or use the keyboard shortcut **Cmd+Enter** on Mac / **Ctrl+Enter** on Windows)
Once an operation is selected, a **"Learn more about this API endpoint"** link is displayed below, opening the corresponding API documentation in a new tab.
3. Select the **consumer** and **connection** to use. The available operations and consumers are filtered dynamically:
* When a **consumer** is selected, only operations matching the consumer's connected APIs are shown
* When an **operation** is selected, only consumers that support this API are listed
* The **connection dropdown** adapts based on available connections:
* If only one connection matches the endpoint, it is **auto-selected** and the dropdown is grayed out
* If multiple connections of the same type are available, the dropdown is **active** and lets you switch between connectors
4. You can optionally enable the **Include raw data** option. When enabled, the raw response from the target connector will be included, allowing you to compare it directly with the processed data. This option is only available for GET endpoints.
5. Fill in the required **parameters** in the **Params** tab, and provide the **request's body** in the **Body** tab when applicable (a sample body is auto-populated from the API schema when available)
6. Click **Send** to execute the request (or use the keyboard shortcut **Cmd+Enter** on Mac / **Ctrl+Enter** on Windows)
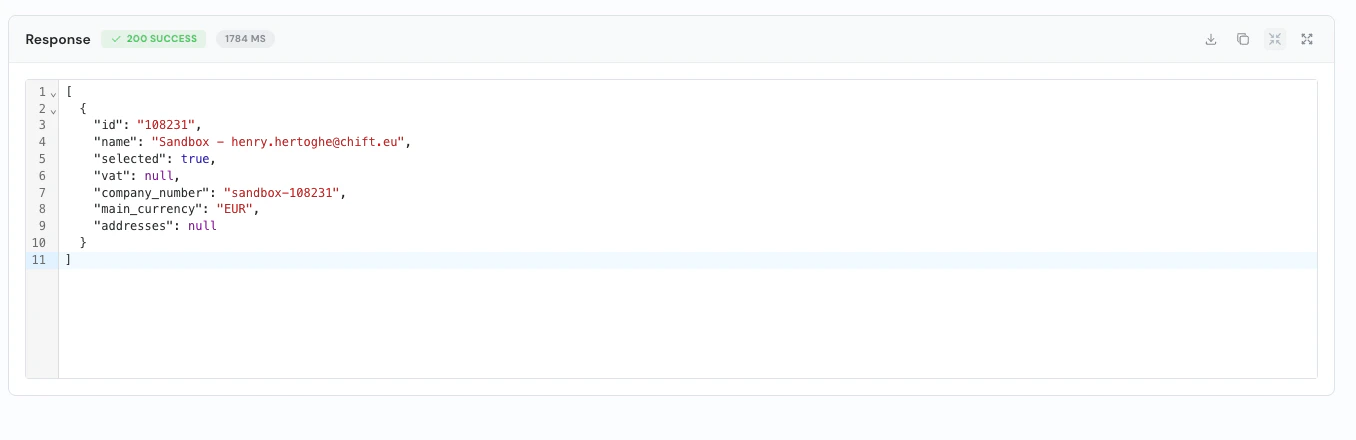
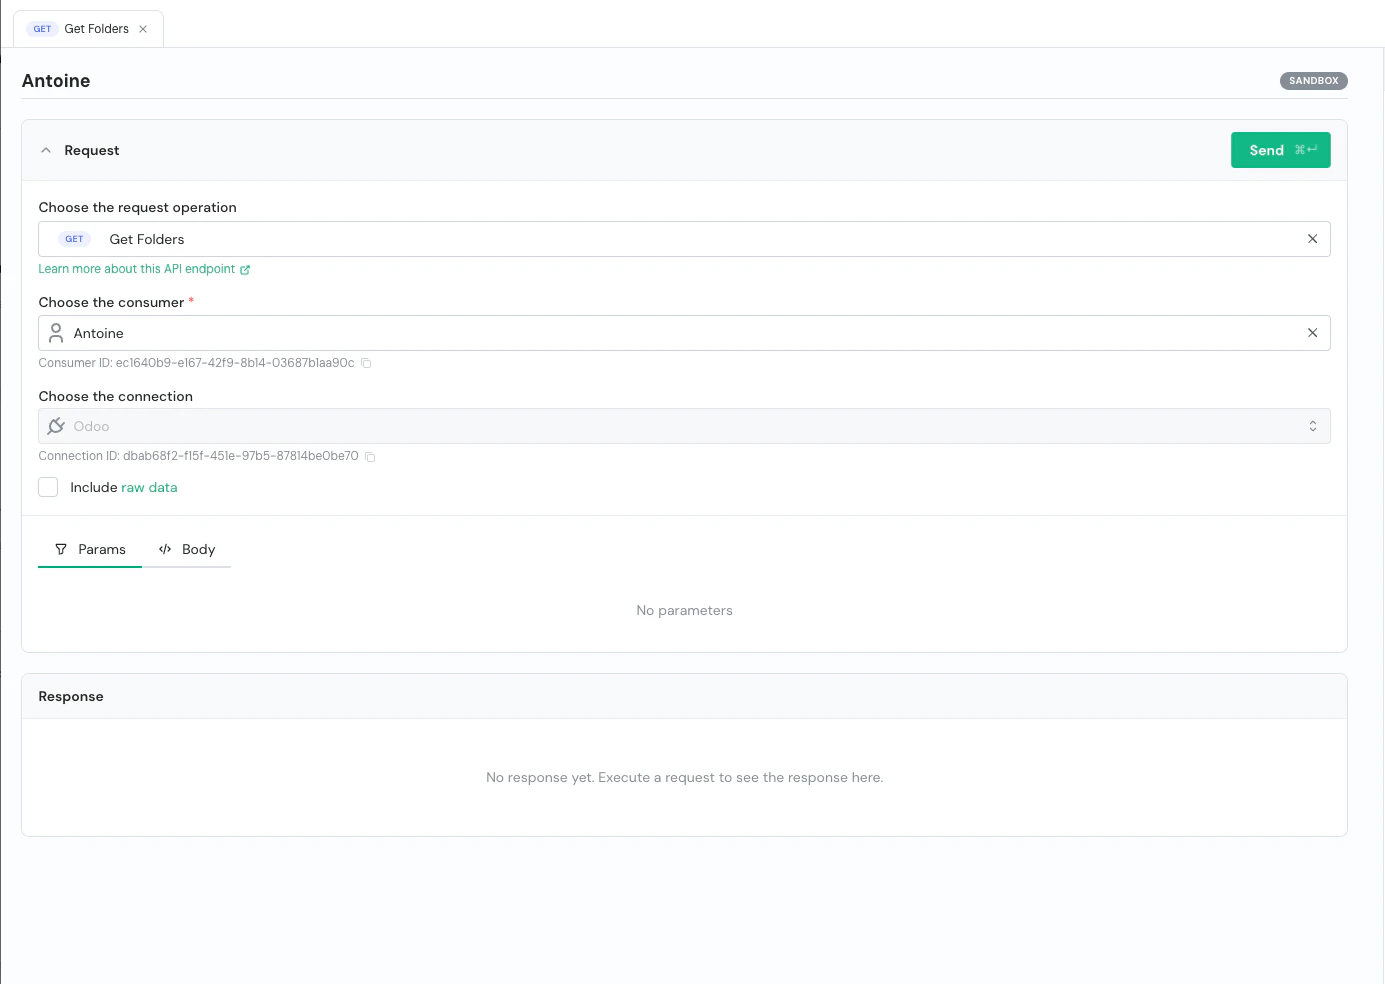 The response is displayed in the **Response** panel with the status code, execution duration, and the full JSON response body with syntax highlighting. You can **download** or **copy** the response, and toggle **fullscreen** mode for easier inspection.
 Executing POST, PUT, PATCH, or DELETE requests in production will actually modify data. Therefore, we strongly recommend testing POST, PUT, PATCH, and DELETE requests only in the sandbox environment.
## Multi-tab support
You can open multiple request tabs simultaneously, allowing you to work on different endpoints or compare responses side by side. Each tab displays the HTTP method and operation name, and can be closed individually.
Tabs persist across sessions so you can pick up right where you left off.
Executing POST, PUT, PATCH, or DELETE requests in production will actually modify data. Therefore, we strongly recommend testing POST, PUT, PATCH, and DELETE requests only in the sandbox environment.
## Multi-tab support
You can open multiple request tabs simultaneously, allowing you to work on different endpoints or compare responses side by side. Each tab displays the HTTP method and operation name, and can be closed individually.
Tabs persist across sessions so you can pick up right where you left off.
 Use the **+** button to add new tabs, **Clear tabs** to close all tabs at once, and the resize icons to switch between compact, default, and fullscreen modes.
 ## Request history
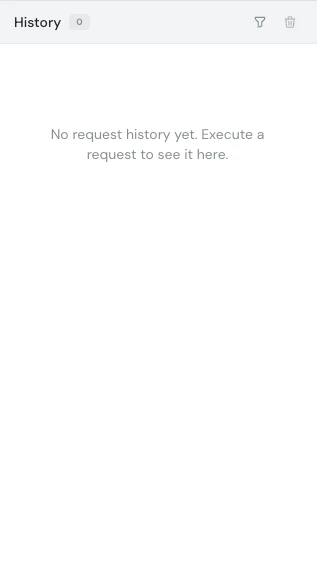
Every executed request is automatically saved in the **History** sidebar on the right side of the API Explorer. Each entry includes:
* HTTP method and path
* Status code
* Consumer and connection name
* Environment (Sandbox / Production)
* Timestamp
Click on any history item to re-open it in a new tab with all parameters pre-filled. You can also delete individual entries or clear the entire history using the trash icon.
History is scoped per account and persists across browser sessions (up to 200 entries).
## Request history
Every executed request is automatically saved in the **History** sidebar on the right side of the API Explorer. Each entry includes:
* HTTP method and path
* Status code
* Consumer and connection name
* Environment (Sandbox / Production)
* Timestamp
Click on any history item to re-open it in a new tab with all parameters pre-filled. You can also delete individual entries or clear the entire history using the trash icon.
History is scoped per account and persists across browser sessions (up to 200 entries).
 ### Filtering history
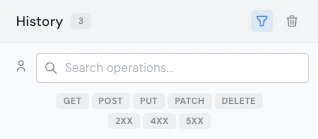
Click the **filter icon** in the History header to reveal the filter panel. You can combine multiple filters to quickly find past requests:
* **Search bar** — Search by operation name, path, consumer name, or connection name
* **Consumer filter** — Click the user icon to filter by a specific consumer
* **HTTP method** — Toggle one or more method badges: GET, POST, PUT, PATCH, DELETE
* **Status category** — Toggle one or more status badges: 2XX (success), 4XX (client error), 5XX (server error)
### Filtering history
Click the **filter icon** in the History header to reveal the filter panel. You can combine multiple filters to quickly find past requests:
* **Search bar** — Search by operation name, path, consumer name, or connection name
* **Consumer filter** — Click the user icon to filter by a specific consumer
* **HTTP method** — Toggle one or more method badges: GET, POST, PUT, PATCH, DELETE
* **Status category** — Toggle one or more status badges: 2XX (success), 4XX (client error), 5XX (server error)
 ## Replaying transactions
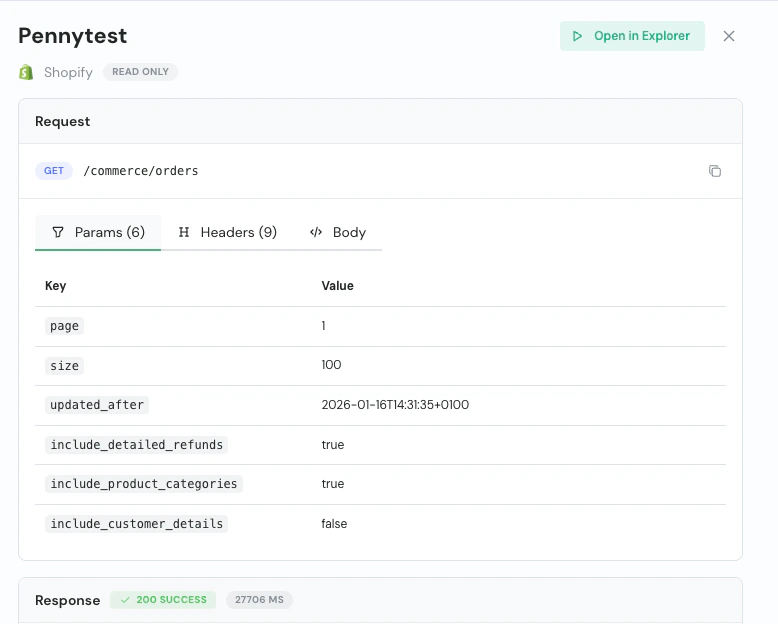
You can replay any transaction directly from the transaction detail view:
1. Navigate to the **Transactions** section
2. Click on the transaction you want to inspect
3. Review the request details (method, path, parameters, headers)
4. Click **Open in Explorer** to load the transaction in the API Explorer with all parameters pre-filled
5. Modify any parameters if needed, then click **Send**
When replaying a transaction, any connector-specific query parameters that are not part of the standard API specification are displayed in a read-only info box for reference.
## Replaying transactions
You can replay any transaction directly from the transaction detail view:
1. Navigate to the **Transactions** section
2. Click on the transaction you want to inspect
3. Review the request details (method, path, parameters, headers)
4. Click **Open in Explorer** to load the transaction in the API Explorer with all parameters pre-filled
5. Modify any parameters if needed, then click **Send**
When replaying a transaction, any connector-specific query parameters that are not part of the standard API specification are displayed in a read-only info box for reference.
 ## Raw data
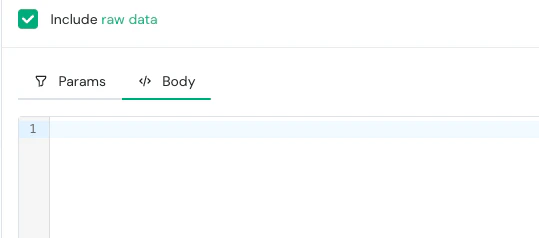
You can optionally enable the **Include raw data** option on GET endpoints. When enabled, the raw response from the target connector will be included alongside the unified Chift response, allowing you to compare it directly with the processed data. This is useful for debugging or when you need to access connector-specific fields not included in the unified model.
## Raw data
You can optionally enable the **Include raw data** option on GET endpoints. When enabled, the raw response from the target connector will be included alongside the unified Chift response, allowing you to compare it directly with the processed data. This is useful for debugging or when you need to access connector-specific fields not included in the unified model.
 On production environments, the raw data option is only available for accounts with the raw data premium feature enabled.
## Drawer sizing
The API Explorer drawer can be resized to fit your workflow:
* **Compact** — minimal overlay for quick checks
* **Default (80%)** — standard working size
* **Fullscreen** — full browser width for detailed inspection
Your size preference is saved and restored automatically.
## Permissions
Access to the API Explorer depends on your role:
| Role | GET requests | POST, PUT, PATCH, DELETE requests |
| -------------- | :------------------------------------: | :------------------------------------: |
| **Admin** | | |
| **Developer** | | |
| **Onboarding** | | |
| **Support** | | |
| **Reporter** | | |
**Admin** and **Developer** roles have full access to all HTTP methods. **Onboarding**, **Support**, and **Reporter** roles can only execute GET requests — write operations (POST, PUT, PATCH, DELETE) are not available.
Contact your account administrator if you need elevated access.
On production environments, the raw data option is only available for accounts with the raw data premium feature enabled.
## Drawer sizing
The API Explorer drawer can be resized to fit your workflow:
* **Compact** — minimal overlay for quick checks
* **Default (80%)** — standard working size
* **Fullscreen** — full browser width for detailed inspection
Your size preference is saved and restored automatically.
## Permissions
Access to the API Explorer depends on your role:
| Role | GET requests | POST, PUT, PATCH, DELETE requests |
| -------------- | :------------------------------------: | :------------------------------------: |
| **Admin** | | |
| **Developer** | | |
| **Onboarding** | | |
| **Support** | | |
| **Reporter** | | |
**Admin** and **Developer** roles have full access to all HTTP methods. **Onboarding**, **Support**, and **Reporter** roles can only execute GET requests — write operations (POST, PUT, PATCH, DELETE) are not available.
Contact your account administrator if you need elevated access.